8 Citations and metrics
Citations matter as they reflect the number of times your research was found to be useful. Although you can look at the citations of each paper, your publications will most likely be summarised into a citation metric to get an overview of how your work is used. Here I provide a guide to some of these metrics, how they are calculated and used. Throughout this book, I suggest that metrics should not be used to measure the performance of academics, and later how the gamification of metrics has led to the detriment of the scientific project (see Chapman et al., 2019). However, this does not mean that you should not be interested in the dissemination of your work, having it read as widely as possible, and ultimately cited when appropriate.
Publishing your research in journals with higher Impact Factors will likely help you get your research read by a larger audience. But you can increase your own readership, and this chapter goes through some of ways in which you can disseminate your work and thereby increase your citations of your work.
8.1 What are your citation metrics?
A number of different databases compile metrics which you can access. In addition, they compile a bunch of extra performance metrics that you would have to pay to access, and in general these are available to a select number of recruitment staff at your institution. Here I will talk about Google Scholar, Scopus and the Web of Science (see Martin-Martin et al., 2018; Martín-Martín et al., 2021 on their differences). In summary, for Biological Sciences, the Web of Science (WoS) and Scopus are likely to give you very similar statistics. Scopus favours social-sciences a little more, so if your subject area does cross-over then you might see some extra citations there. Google Scholar is going to give you the highest metrics, but it doesn’t mean that they are particularly false (although this is certainly the not the best curated database). The joy of Google Scholar is that it is much more cosmopolitan on the journals and theses that it includes. So it actually gives you a better idea of who is using your research. It will also pick up grey literature and predatory publishers, so you should interpret the outputs with care.
Each of these databases offers you the opportunity of curating your own author profile that (in the case of Scopus and WoS) will link with your ORCID, and (in the case of WoS) link with your Publons account (note that Publons has now been taken-over by WoS). Your institution may want you to actively curate your profile to help them with assessing your institution’s metrics. It is surprising how bad these are when left to the bots, especially if you have your name recorded in more than one way. Use open source tools where you can, and beware of linking too many publisher owned tools together as these can also be used to spy on you. As of September 2022, all citation data associated with journal articles indexed by Crossref are now open access (Singh Chawla, 2022). Hopefully, this will mean that more open source tools providing citation data will become available. I also think that it’s worthwhile creating and curating a Google Scholar profile, and link it directly to your website. As an editor, this is one of the easiest ways of looking up an author or potential reviewer. For anyone that uses Google Scholar, your name will then be underlined, and other users can quickly find your other published works. Google Scholar also indexes preprints, which may be a boon to you as an Early Career Researcher.
Because all of these indices are cumulative, you can expect that anyone who started their career before you will have higher numbers. It is also worth being aware that some fields get higher citations because there are more people working in them, and therefore more articles are being published.
8.1.1 Total Citations
Your total number of citations is simply the total number of times that anyone has cited one of your works within the respective database. Note that, the cited article itself doesn’t have to appear in the database in order to be counted in total cites, but (clearly) the article that cites it must. For this reason, you are likely to have a different number of total citations in different databases.
8.1.2 H-index
Very simply, the H-index is the ranked count of the number of your publications that have received at least the same number of citations (Hirsch, 2005). The easiest way to calculate your H-index is to have a list of all your papers and their citations in a list, ranked from the highest to lowest cited (see Table 8.1). Counting down from the highest cited paper, you stop when the number of citations reaches the same as the numbered citation in the list. For example, your H-index will be 5 if you have authored 5 or more publications with 5 of them having received 5 citations or more. If 6 have received 5 citations, you’ll still only have an H-index of 5, because for the H-index to grow to 6, the top 6 articles will need to be cited 6 times or more.
| Rank | Title | Cited By | Year |
|---|---|---|---|
| 1 | A review of most important findings | 48 | 2017 |
| 2 | The first paper I presented at a conference | 19 | 2017 |
| 3 | Another significant finding | 8 | 2018 |
| 4 | First Open Access paper with snappy title | 8 | 2020 |
| 5 | This paper spent a long time online first | 6 | 2019 |
| 6 | Another review receiving some attention | 5 | 2020 |
| 7 | A paper that shows important findings | 2 | 2020 |
| 8 | Obscure note that I managed to self-cite | 1 | 2018 |
| 9 | The only citation is my own | 1 | 2019 |
| 10 | Hot off the press | 0 | 2021 |
| — | Total Citations | 98 | — |
Your H-index will grow very quickly as you publish articles from your thesis, but the growth slows as the H-index grows as it requires more citations of particular papers (of your top cited papers). Growing an H-index is therefore very difficult, and it’s probably one of the hardest of these metrics to manipulate. Because the H-index is cumulative, people with very large H-indices (>100) are usually very senior academics with very good networks, and low R numbers.
Note that while the H-index is usually calculated for individuals, groups of people can also have an H-index, such as a department, a school, faculty or even university. Indeed, you can calculate an H-index for any set of articles using the citations that they receive.
8.1.2.1 Normalisaing the H-index and other citation metrics
The H-index (and other indices) are sometimes normalised for field of study (fixed - dynamic; broad - narrow), types of citing documents and year of publication (see Ioannidis, Boyack & Wouters, 2016). You can expect to see some of these field normalisations, for example by Dimensions (see Figure 8.1) who provide you with, total citations (as the name implies), Recent citations (citations within the last 2 years), field citation ratio (comparing the article to ones of a similar age in in a similar field), and the Relative citation ratio (relative to 1.0, this gives you an idea of how well cited the article is compared to others in its area of research). As an Early Career Researcher, you may feel that your H-index is not particularly impressive (Table 8.1), in which case, you may want to consider some of these normalised metrics if they show your articles in a more favourable light.
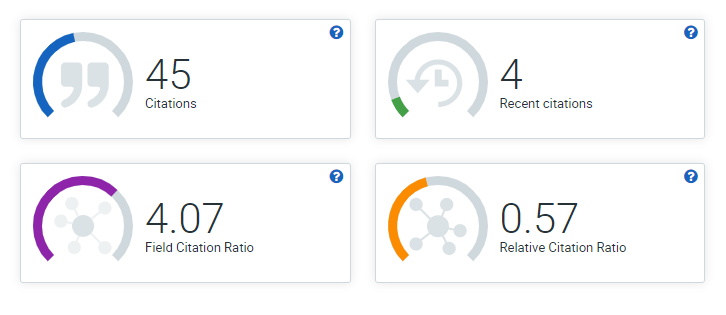
FIGURE 8.1: Normalising citation metrics. Some databases will provide you with normalised values for citations, like the one shown here by Dimensions for a paper cited 45 times, and 8% of these citations are from the past two years (normalised for time since published). The Field Citation Ratio (FCR) of this paper is 4.07 times more citations, when compared to other papers in the field. The Relative Citation Ratio (RCR) compares this paper to other NIH funded publications in the same area of research and year, where they will be the same as the mean (at 1.0), more or (in this case) less at 0.57.
8.1.3 G-index
The G-index is similar to the H-index, but places more emphasis on the actual number of citations in your top cited articles (Egghe, 2006). To calculate this, you will need to organise your publications by the number of times that they have been cited. For ease of explanation, start with your H-index, and add up citations to all of the preceding articles (1st, 2nd, 3rd, 4th & 5th). For example, in order for your G-index to be 5, all citations up to 5 will need to be more than or equal to 25 (52). For your G-index to increase to 6, the sum of all citations to your first 6 papers will need to be equal or greater than 36 (62). Our fictional researcher in Table 8.1 has a G-index of 9 as citations to the first 9 articles add up to 98 which is greater than 81 (i.e. >92).
Because the G-index uses all citations in your top cited articles, not simply the minimum used to obtain the H-index, your G-index should always be equal to your H-index and will often be higher. This is because of the phenomenon that articles that get cited more, continue by getting increasing numbers of citations (known as the Matthew Effect, see below). Therefore, you may favour using the G-index if your top papers are particularly well cited.
8.1.4 R-index
Your R-index is a measure of your active network (Ioannidis, 2008). It is rather like the H-index it that it records the count of the number of people that you’ve collaborated with on a number of papers. But these need to be the same people. This is then divided by your total number of papers. For example, if your thesis produced 5 papers with the same 5 authors and this is your total number of papers, your R-index will be 1. However, if two of the papers lacked one of the people, your R-index will drop to 1.66. If you don’t work with those 5 other people again, then your R-index will grow continuously until you have another productive network. See the section on networks for a fuller explanation of the R-index and the importance of networks.
8.1.5 a-index
The a-index is calculated from the total number of citations divided by H2(Sidiropoulos, Katsaros & Manolopoulos, 2007). In the example given in Table 8.1, Total citations is: 98. H2 is 25 (52), and so the a-index is 98/25 = 3.92. This index gives a measure of how top-heavy someone’s citations are. The a-index gets larger as the highest ranked papers receive a disproportionate amount of citations. This is known as the Matthew Effect (see below), and this is a general feature of a lot of researchers’ citation ranks.
8.1.6 i10-index
Your i10 index represents the number of articles that you have written which have been cited 10 times or more in that database. The i10 is often expressed over a time frame (for example the last 5 years) which may well exclude papers that you write that have an immediate but not a lasting impact. Moreover, looking at an index calculated over the last 5 years will let you know how active older colleagues are. Given that most indices are cumulative, older researchers almost always look better. But a time constrained index may provide additional insight into their relative productivity.
8.1.7 m-index
Another idea for decreasing the impact of older researchers is to consider the m-index (Hirsch, 2005). This takes the standard H-index, and divides it by the number of years since the first publication of that researcher. The m-index has a levelling effect between older and younger researchers, with high scores being ~1.5 (Kelly & Jennions, 2006). However, although the m-index might be a better way of comparing young and old researchers, as with other indices, reducing careers to single numbers should always be considered dubious (Kelly & Jennions, 2006). Moreover, such methods clearly place people who have a hiatus in their career, for example to raise a family, at a disadvantage.
8.1.8 H-frac
H-frac is the same as the H-index, except that citations for articles are divided by the number of authors (Koltun & Hafner, 2021). Koltun and Hafner (2021) propose that H-frac is more robust as it represents a better correlation with awards to individual scientists than the H-index (see their excellent website for an explanation). Their analysis shows that it accounts for changes in author behaviour, such as hyperauthorship, based on their retrospective analysis of authors in physics. I am wary of advocating a new index that may drive future behaviour in ascribing authorship. If citations are divided by number of authors, this will likely make lead authors more circumspect about adding potential authors to their byline. Given that there are already difficulties in some authors being represented, I prefer not to have a disincentive for adding authors. Like other analyses that are made on vast amounts of existing data in citation databases, this does not predict how future behaviour will change when the incentive changes.
8.1.9 Other metrics
There are more metrics for authors behind paywalls, but there are also metrics on social-media sites such as ResearchGate’s ‘RG score’. The way that ResearchGate calculates it’s RG score is rather opaque and is not simply done on publication metrics, but on the way that you interact with your ResearchGate community. Similarly, many publishers will grant you metrics that will be boosted by the number of times that you publish with them.
There are also Altmetrics handed out as a means of showing the alternative impact for articles that you’ve written. These are explained in Part III.
8.2 How to increase your citations
Increasing your total number of citations is likely to impact positively on all of your metrics, but this is not necessarily true, and hence why you may be assessed on more than one metric. In the following subsections, I go through some of the well known ways in which you can increase the readership of your paper, and with this the likelihood that someone will cite it.
8.2.1 Open Access
The subject of Open Access (OA) is covered in Part II, and so won’t be covered in detail here. It is important only to mention here that having your article OA will likely increase citations (e.g. Piwowar et al., 2018), but that you don’t need to pay a publisher in order to produce an OA version of your article.
8.2.2 Open Data and other open resources in repositories
There are studies that show that transparent practices such as providing your data (e.g. Piwowar, Day & Fridsma, 2007) and code on an Open Access platform (like Bitbucket, Github, OSF and Zenodo) increases citations not only to your manuscript, but also to the DOI associated with each of these repositories (e.g. Fernández-Juricic, 2021). Making transparency a part of all your research will also make your work more reproducible, a trait that we hope will be considered over and above other metrics mentioned here.
8.2.3 Media release
Some journals will want you to write a media release that they may use to promote your paper. You can also proactively write a press release and send it to the media office at your institution. Writing a release for the media is very different from scientific writing, and you can find a guide in Part III.
8.2.5 Popular articles
Writing popular articles is a good way to ensure that your paper gets some media attention. There are outlets like The Conversation that specialise in publishing popular articles written by academics. But you might also find that academic societies that you belong to have newsletters that you can contribute a popular article to about your paper. As long as the circulation of these newsletters is big it should enhance the numbers of people that eventually read about your work.
8.2.6 Self-citations
Self citation is when you cite a paper that you or one of your co-authors have written or co-authored. This is probably one of the oldest and most widely practised ways of increasing citations to your articles. It is generally frowned upon to have gratuitous self citations, but the situation may be complex and biased (see Flatt, Blasimme & Vayena, 2017).
However, it is also true that you are more than likely to cite your own work because you have probably published in the same area previously. By the end of your PhD you will already be citing publications that you produced at the beginning. Self-citations are also known to facilitate the ‘Matthew effect’, whereby because you increase your level of citations of a particular paper, others will also cite it (Fowler & Aksnes, 2007; Flatt, Blasimme & Vayena, 2017). There is evidence to suggest that the proportion of self citations will change in different disciplines, and that they will increase with increasing numbers of collaborative co-authors (Davarpanah & Amel, 2009). Self-citations are also known to increase with increasing career length (Mishra et al., 2018), presumably with the growth of ones own publication base in relevant areas. Because of this effect, self-citation can be regarded as a measure of highly productive authors (Mishra et al., 2018).
There has even been a call for another metric, the s-index which is the equivalent of the h-index but for self citations (Flatt, Blasimme & Vayena, 2017): “the total number of s papers that an author has published that have at least the same amount of s self-citations”.
How do you make sure that their citations are not gratuitous? Simply by only citing a work when you need to. Note that many citation indices will provide your citation scores both with and without self citations. As a rule of thumb, metrics suggest reasonable levels self-citations in the biological sciences are ~30% (Aksnes, 2003). In short, there is nothing wrong with citing yourself, but you should only do so when you need to.
8.2.7 Citing papers submitted and in press
If you, or others, have papers that are ‘in press’, then you can cite these in a manuscript submitted to a journal for peer review. However, ‘in press’ does mean that they have been formally accepted by an editor at a journal. These days the concept of ‘in press’ is not quite the same as it was. It used to take months before an accepted paper would appear in a journal issue. These days it is likely that you’ll have an online version very quickly after acceptance. Hence, by the time you submit a manuscript with citations to papers that are ‘in press’, by the next round of revisions or acceptance, they should be fully available. If papers are not available by the time you send back your proofs, then you may well be asked to remove these citations. My impression is that many authors claim that a paper is ‘in press’ when the reality is that it’s simply been submitted and that they are hoping it will be ‘in press’.
You should not add citations to manuscripts that have simply been submitted to other journals. If you really need to, then submitting and citing as a preprint is really your only option. Some editors will not accept citations of preprints. An exception to this might be when papers are submitted together to the same journal at the same time. If this is the case, then you can point this out to the editor in your cover letter.
If the contents of this manuscript are pivotal for understanding the submitted version, then you should make sure that there is a copy of the ‘in press’ or ‘submitted’ manuscript available for the reviewers. The easiest way of doing this will be as a preprint. If this is not possible, then you may need to upload the ms as an additional file - but you should seek guidence from the journal editor.
8.2.8 Presenting the results of your paper at a conference
Probably the most traditional way of generating a bigger audience for your work is to talk about it (or present it as a poster) at a conference with an audience that is likely to appreciate your work. Everyone else at the conference will likely also be wanting you to know their work, so you’ll need to target your audience carefully (possibly in a symposium), and make sure that the audience can access your work (for example through a QR code in your slide or on the poster). Making your talk memorable will likely have people recall your work, and cite it if they are undertaking a similar or relevant study.
8.2.9 Organising symposia and having special issues
Having your research published in a special issue is a great way of getting citations. This is because special issues have research on a theme and so many people will be drawn to the issue and are then more likely to see your work. This includes other people who participate in the special issue and are de facto already interested in this line of research. This increased visibility of your research is, in my opinion, a good reason for joining a special issue if you have the chance.
Special issues are often edited by people who have an interest in pulling together this kind of research. They may encourage other authors in the special issue to cross cite articles, and may write an editorial that includes citations to yours and other papers. Of course, the best position to be in is when you are one of the organising members. Your name will be associated with the special issue as well as your contribution. This means that when the special issue is published, each of the papers in it will already have citations leading to a positive Matthew Effect from day one of publication.
Probably the easiest way of pulling together a special issue is to organise a symposium at a conference and ask those participating to contribute to the special issue. If this is done long enough in advance and you are good at organising then it can work very well. Talk to your mentor about the possibility of their help in organising a symposium.
8.2.10 Traditional Media
To get your work cited you need to get people reading it. As scientists read the traditional media it can be a way of bringing your work to their attention, and result in additional citations. There are other benefits of having your work highlighted by the traditional media. You should always make sure that you get a plug in for your institution and any prominent funders. There are now additional metrics (e.g. Altmetrics) that track traditional and social media and in the future you might be able to use these altmetrics to your advantage in getting a job, a promotion or tenure.
8.2.11 Not so legitimate ways of increasing citations
In addition to the legitimate ways of increasing citations and visibility of your work that I’ve listed above there are other illegitimate ways that I have heard about. I have heard of certain laboratories that have quid pro quo arrangements where they agree to cite each other’s publications (see Ritchie, 2020).
Another way of increasing citations might be to have a co-author who is very well known. Certainly having a co-author who is very well known is likely to increase your citations but only if they actually do something to contribute to the work. See the section on honorary authorship.
Gratuitous self citations. As mentioned above, you should really only cite your own work when necessary, and not more than this.
Journals have also been known to manipulate citations in order to increase their Impact Factors and therefore their perceived level of quality. A group of physics journals from Romania were found to have clearly manipulated self-citations to increase their own impact factors (see Heneberg, 2016). There can also be a level of coercive pressure from journal editors to cite papers from their journals published within the two year citation window (Chorus & Waltman, 2016). Editors can also form citation cartels in order to improve the rankings of their journals (Franck, 1999). Such practices are now systematically analysed by the larger literature databases, and clear levels of Impact Factor manipulation result in delisting of the journal from the database.
8.3 Well cited articles are likely to be cited more
Articles that already have a lot of citations are more likely to pick up extra citations than the ones that have very few. This phenomenon, sometimes referred to as the Matthew Effect (Merton, 1968; see Teixeira da Silva, 2021a), is exaggerated by search engines like Google Scholar that order the results of searches by the number of times an article is cited. Like people looking for a website, academics looking for a paper are more likely to choose one on the first page of Google Scholar than to keep searching through Google Scholar until they find your study. In effect, this means that those that already have large research groups and that can generate initial citations, will get more citations and increase their own standing. Or, in other words, those that are already in a commanding position will automatically generate more (Casadevall & Fang, 2012) - the winner takes it all.
Interestingly, there is some evidence that a similar effect is happening in journals, with those that have the highest Impact Factors inflating at faster rates than those with low Impact Factor (Neff & Olden, 2010). This is of concern, as it suggests that there will be a run-away effect of journals with top Impact Factors - something only of interest to the publishing houses that own them, and prompting bad science.
As you read through papers in your specialist area you will notice that there are some papers that seem to get cited over and over again as standard examples of a particular phenomenon. These are often some of the first examples published and have also been published in higher ranking journals. If you are the 20th person to have shown a particular phenomenon then it is unlikely that your paper is going to end up being cited the most.
There have been investigations into what makes certain papers more likely to be cited further. One of the factors that appears to be significant is the “small-study effect” - low precision studies that produce large effect sizes, either spuriously Fanelli, Costas & Ioannidis (2017).
8.2.4 Social media
Social media is another way of getting your article to the attention of more people. Twitter has been adopted by many scientists and tweeting out an article that gets retweeted by the right people (i.e. social media hubs - with lots of followers) can get you tens or even hundreds of thousands of views. This is likely to be far in excess of anything your article will get by passively sitting on the journal website.
At this point it is worth telling the tale of Neil Hall, who in 2014 wrote a slightly mischievous short article proposing a new citation metric which he called the K-index to reflect the number of followers on Twitter divided by the total number of citations of the same researcher (Hall, 2014). In the article, he found (with a non-random selection of 40 researchers on Twitter) that there was indeed a correlation between well-cited individuals and the number of their Twitter followers. He then postulated that some people with large numbers of Twitter followers (high celebrity) were not authoritative as they did not have lots of citations (a measure of scientific value):
A social media backlash followed swiftly. Within days of the online publication, the Tweets started rolling in, with a great many people very upset with what they saw as an insult to younger researchers who had a good social media following on Twitter (Woolston, 2014). The social media eruption over this article made it score an Altmetric of 2489, ranked 1st of articles published at that time in that journal, and 9th in all journals. Although Hall had written the article in a light hearted way (poking fun at metrics and social media), the backlash was massive (although some did appreciate the joke).
There are several lessons here: First, is that what seems like a joke to you (including those immediately around you) may be offensive to others, especially those from other cultures. Second, is that items in social media can go badly wrong, and be taken in ways that you had never imagined. Third, is that social media goes well beyond academia - as is the intention with the dissemination, and that this may also have repercussions.
The bottom line is that social media can be an excellent way to reach a very wide audience, but that you must use it responsibly, or risk that it might do you and your reputation considerable damage.
8.2.4.1 Academic social media sites
Sites such as ResearchGate and Academia.edu will play a role in increasing citations to your work, especially if you have a large following. Rather like sharing on traditional social-media sites, the more people who are exposed to your work, the more likely they are to read and cite it. In the case of academic social media sites, the audience is more niche and so more likely to find your work of interest.